Solar PV output in the UK since 2021. Units are GWh. Source of data: University of Sheffield Solar.
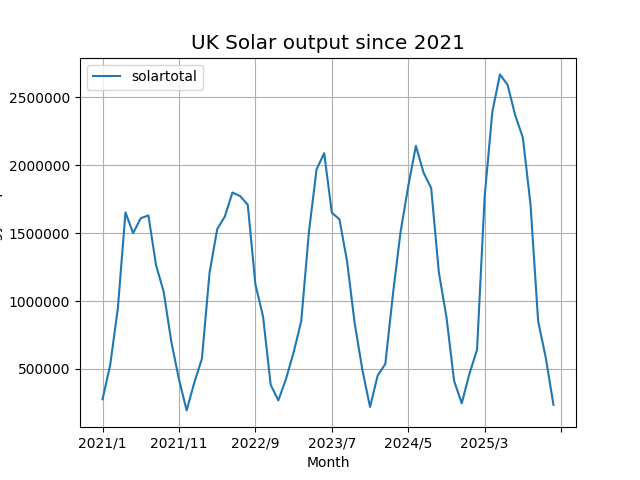
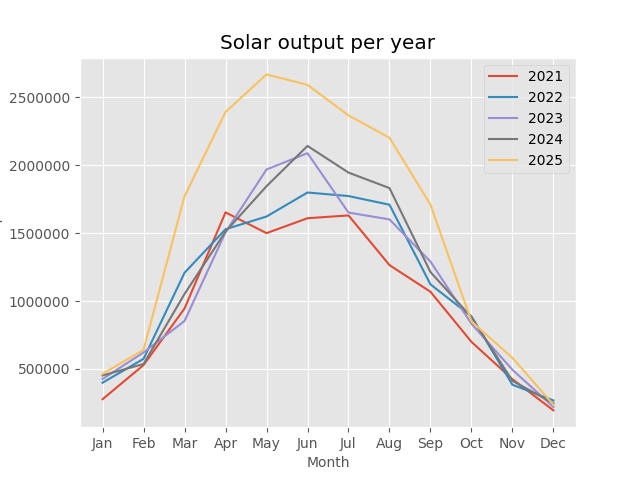
Solar output per month
| Total | Jan | Feb | Mar | Apr | May | Jun | Jul | Aug | Sep | Oct | Nov | Dec | |
|---|---|---|---|---|---|---|---|---|---|---|---|---|---|
| 2021 | 11,794,165 | 277,338 | 528,868 | 944,895 | 1,652,432 | 1,499,628 | 1,609,390 | 1,629,960 | 1,264,455 | 1,068,096 | 699,429 | 424,433 | 195,241 |
| 2022 | 13,273,977 | 398,804 | 574,612 | 1,208,134 | 1,528,475 | 1,621,867 | 1,798,729 | 1,772,533 | 1,708,745 | 1,122,371 | 887,331 | 384,040 | 268,336 |
| 2023 | 13,552,192 | 426,713 | 622,095 | 853,540 | 1,506,940 | 1,968,010 | 2,087,500 | 1,650,835 | 1,600,335 | 1,289,717 | 832,842 | 493,462 | 220,203 |
| 2024 | 14,066,258 | 452,391 | 536,362 | 1,051,749 | 1,510,780 | 1,844,456 | 2,140,826 | 1,945,310 | 1,830,809 | 1,212,819 | 880,969 | 412,462 | 247,325 |
| 2025 | 18,620,168 | 463,913 | 641,280 | 1,770,592 | 2,391,236 | 2,667,727 | 2,590,697 | 2,366,128 | 2,201,539 | 1,708,972 | 853,404 | 591,984 | 372,696 |
| 2026 | 2,039,015 | 441,983 | 571,979 | 1,025,053 | 0 | 0 | 0 | 0 | 0 | 0 | 0 | 0 | 0 |
Charts updated: 2026-03-21. Code available on Github.